Deep insights into every agent's performance, now at a glance — May 2026 Update
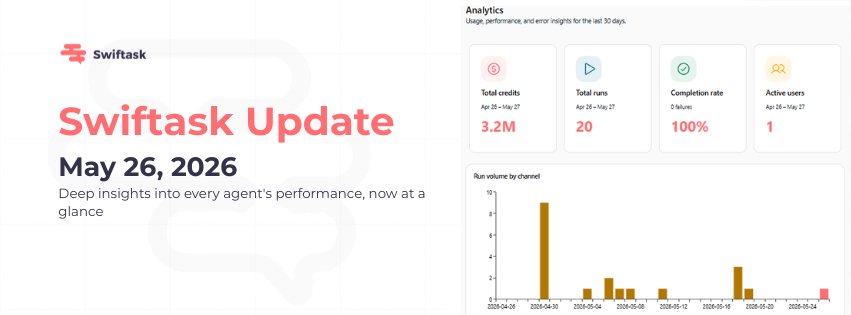
We're excited to introduce a new analytics dashboard for AI agents. You can now track usage, performance, and errors for each agent over the last 30 days, giving you the visibility you need to optimize deployments and understand where your credits are going.
Agent analytics dashboard
Every agent now has its own analytics hub, showing you exactly how it's performing. Four key metrics give you an instant snapshot: total credits consumed, total runs executed, completion rate, and active users. Scroll down for deeper visualizations that reveal trends, patterns, and performance over time.
Find it here: Agent → Agent modification space → Left sidebar → Analytics (under Deployment)
What you'll see:
Total credits : Credits consumed by this agent in the period
Total runs : Number of times the agent was executed
Completion rate : Percentage of successful runs, with failure count
Active users : Number of unique users who triggered the agent
Run volume by channel : Bar chart breaking down runs by Swiftask vs. other channels
Active users trend : Daily active user count over the 30-day window
Credits over time : Line chart showing credit consumption patterns and spikes
Avg credits per run : Efficiency metric showing average cost per execution
Run status over time : Stacked bar chart comparing successful vs. failed runs by day
All data covers the last 30 days and updates in real-time as your agent runs.
Available on: All plans
How to test it
Go to any AI agent in your workspace
Open the agent modification space (click to edit)
In the left sidebar, scroll to the Deployment section
Click Analytics at the bottom
Verify the 4 metric cards display with data from your agent
Scroll down to confirm all 5 visualizations are rendering correctly
Run your agent a few times and check that metrics update in real-time