June 11th, 2026
Better visibility into your AI agent spending — June 2026 Update
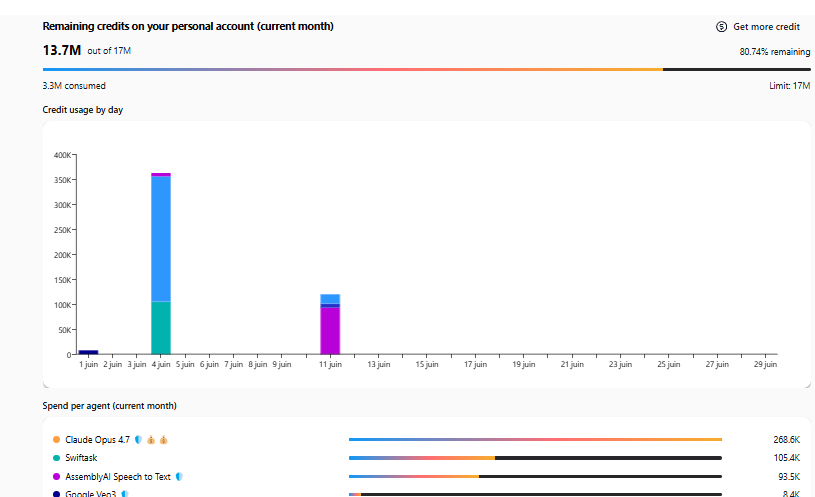
We've redesigned your personal usage dashboard to give you crystal-clear insights into how your credits are being consumed. Whether you're tracking daily usage patterns or understanding which agents are costing the most, everything is now easier to see at a glance.
Credit usage overview
At the top of your dashboard, you'll find your remaining credits for the current month displayed as a visual progress bar. You can instantly see:
Total remaining credits vs. your monthly limit
Percentage of credits consumed
Daily consumption breakdown in an interactive bar chart
Spend per agent breakdown
A new section shows exactly how much credit each of your agents is consuming this month, ranked by usage. This makes it simple to:
Identify your most resource-intensive agents
Spot unexpected usage spikes
Optimize your agent fleet based on real consumption data
Where to find it
Access your updated dashboard from your account menu → Usage dashboard (or Settings → Your account → Usage).
How to test this
Navigate to your usage dashboard from your account menu
Review the remaining credits progress bar at the top
Scroll down to see the "Credit usage by day" chart with daily consumption patterns
Check the "Spend per agent (current month)" section to see which agents are consuming the most credits
Hover over chart elements to see detailed credit amounts for each day and agent
Note: This improvement is available to all Swiftask users on all plans.